class: center, middle, inverse, title-slide # Data wrangling with <code>tidyverse</code> ## Maria Novosolov ### 05-05-2020 --- <style type="text/css"> .xaringan-extra-logo { width: 110px; height: 128px; z-index: 0; background-image: url('img/tidyverse.png'); background-size: contain; background-repeat: no-repeat; position: absolute; top:1em;right:1em; } </style> # Tidyverse is a collection of packages .center[ <img src="img/tidyverse_core.png" width=50%> ] --- # The advantages .large[ - shared syntax & conventions - tibble/data.frame in, tibble out - neat code ] --- # Tidy data >If I had one thing to tell biologists learning bioinformatics, it would be “write code for humans, write data for computers”. > >— Vince Buffalo (@vsbuffalo) July 20, 2013 --- |Film |Gender |Race | Words| |:--------------------------|:------|:------|-----:| |The Fellowship Of The Ring |Female |Elf | 1229| |The Fellowship Of The Ring |Male |Elf | 971| |The Fellowship Of The Ring |Female |Hobbit | 14| |The Fellowship Of The Ring |Male |Hobbit | 3644| |The Fellowship Of The Ring |Female |Man | 0| |The Fellowship Of The Ring |Male |Man | 1995| |The Two Towers |Female |Elf | 331| |The Two Towers |Male |Elf | 513| |The Two Towers |Female |Hobbit | 0| |The Two Towers |Male |Hobbit | 2463| --- # Does your code resemble this? ```r starwars_human_subset <- subset(starwars,species == "Human") starwars_human_subset$bmi <- starwars_human_subset$mass / (0.01 * starwars_human_subset$height)^2 fattest_human_from_each_planet <- aggregate(bmi ~ homeworld,data = starwars_human_subset, FUN = "max") fattest_human_from_each_planet <- merge( x=fattest_human_from_each_planet, y=starwars_human_subset,by = c("homeworld","bmi")) fattest_human_from_each_planet <- fattest_human_from_each_planet [,1:5] ```  --- # Code should be pleasant to read  --- # Tibbles >Tibbles are data.frames that are lazy and surly: **they do less** (i.e. they don't change variable names or types, and don't do partial matching) and **complain more** (e.g. when a variable does not exist). This forces you to confront problems earlier, typically leading to cleaner, more expressive code. .center[ <img src="img/tibble.png" width=20%> ] https://tibble.tidyverse.org/ --- # `data.frame` ```r iris ``` ``` ## Sepal.Length Sepal.Width Petal.Length Petal.Width Species ## 1 5.1 3.5 1.4 0.2 setosa ## 2 4.9 3.0 1.4 0.2 setosa ## 3 4.7 3.2 1.3 0.2 setosa ## 4 4.6 3.1 1.5 0.2 setosa ## 5 5.0 3.6 1.4 0.2 setosa ## 6 5.4 3.9 1.7 0.4 setosa ## 7 4.6 3.4 1.4 0.3 setosa ## 8 5.0 3.4 1.5 0.2 setosa ## 9 4.4 2.9 1.4 0.2 setosa ## 10 4.9 3.1 1.5 0.1 setosa ## 11 5.4 3.7 1.5 0.2 setosa ## 12 4.8 3.4 1.6 0.2 setosa ## 13 4.8 3.0 1.4 0.1 setosa ## 14 4.3 3.0 1.1 0.1 setosa ## 15 5.8 4.0 1.2 0.2 setosa ## 16 5.7 4.4 1.5 0.4 setosa ## 17 5.4 3.9 1.3 0.4 setosa ## 18 5.1 3.5 1.4 0.3 setosa ## 19 5.7 3.8 1.7 0.3 setosa ## 20 5.1 3.8 1.5 0.3 setosa ## 21 5.4 3.4 1.7 0.2 setosa ## 22 5.1 3.7 1.5 0.4 setosa ## 23 4.6 3.6 1.0 0.2 setosa ## 24 5.1 3.3 1.7 0.5 setosa ## 25 4.8 3.4 1.9 0.2 setosa ## 26 5.0 3.0 1.6 0.2 setosa ## 27 5.0 3.4 1.6 0.4 setosa ## 28 5.2 3.5 1.5 0.2 setosa ## 29 5.2 3.4 1.4 0.2 setosa ## 30 4.7 3.2 1.6 0.2 setosa ## 31 4.8 3.1 1.6 0.2 setosa ## 32 5.4 3.4 1.5 0.4 setosa ## 33 5.2 4.1 1.5 0.1 setosa ## 34 5.5 4.2 1.4 0.2 setosa ## 35 4.9 3.1 1.5 0.2 setosa ## 36 5.0 3.2 1.2 0.2 setosa ## 37 5.5 3.5 1.3 0.2 setosa ## 38 4.9 3.6 1.4 0.1 setosa ## 39 4.4 3.0 1.3 0.2 setosa ## 40 5.1 3.4 1.5 0.2 setosa ## 41 5.0 3.5 1.3 0.3 setosa ## 42 4.5 2.3 1.3 0.3 setosa ## 43 4.4 3.2 1.3 0.2 setosa ## 44 5.0 3.5 1.6 0.6 setosa ## 45 5.1 3.8 1.9 0.4 setosa ## 46 4.8 3.0 1.4 0.3 setosa ## 47 5.1 3.8 1.6 0.2 setosa ## 48 4.6 3.2 1.4 0.2 setosa ## 49 5.3 3.7 1.5 0.2 setosa ## 50 5.0 3.3 1.4 0.2 setosa ## 51 7.0 3.2 4.7 1.4 versicolor ## 52 6.4 3.2 4.5 1.5 versicolor ## 53 6.9 3.1 4.9 1.5 versicolor ## 54 5.5 2.3 4.0 1.3 versicolor ## 55 6.5 2.8 4.6 1.5 versicolor ## 56 5.7 2.8 4.5 1.3 versicolor ## 57 6.3 3.3 4.7 1.6 versicolor ## 58 4.9 2.4 3.3 1.0 versicolor ## 59 6.6 2.9 4.6 1.3 versicolor ## 60 5.2 2.7 3.9 1.4 versicolor ## 61 5.0 2.0 3.5 1.0 versicolor ## 62 5.9 3.0 4.2 1.5 versicolor ## 63 6.0 2.2 4.0 1.0 versicolor ## 64 6.1 2.9 4.7 1.4 versicolor ## 65 5.6 2.9 3.6 1.3 versicolor ## 66 6.7 3.1 4.4 1.4 versicolor ## 67 5.6 3.0 4.5 1.5 versicolor ## 68 5.8 2.7 4.1 1.0 versicolor ## 69 6.2 2.2 4.5 1.5 versicolor ## 70 5.6 2.5 3.9 1.1 versicolor ## 71 5.9 3.2 4.8 1.8 versicolor ## 72 6.1 2.8 4.0 1.3 versicolor ## 73 6.3 2.5 4.9 1.5 versicolor ## 74 6.1 2.8 4.7 1.2 versicolor ## 75 6.4 2.9 4.3 1.3 versicolor ## 76 6.6 3.0 4.4 1.4 versicolor ## 77 6.8 2.8 4.8 1.4 versicolor ## 78 6.7 3.0 5.0 1.7 versicolor ## 79 6.0 2.9 4.5 1.5 versicolor ## 80 5.7 2.6 3.5 1.0 versicolor ## 81 5.5 2.4 3.8 1.1 versicolor ## 82 5.5 2.4 3.7 1.0 versicolor ## 83 5.8 2.7 3.9 1.2 versicolor ## 84 6.0 2.7 5.1 1.6 versicolor ## 85 5.4 3.0 4.5 1.5 versicolor ## 86 6.0 3.4 4.5 1.6 versicolor ## 87 6.7 3.1 4.7 1.5 versicolor ## 88 6.3 2.3 4.4 1.3 versicolor ## 89 5.6 3.0 4.1 1.3 versicolor ## 90 5.5 2.5 4.0 1.3 versicolor ## 91 5.5 2.6 4.4 1.2 versicolor ## 92 6.1 3.0 4.6 1.4 versicolor ## 93 5.8 2.6 4.0 1.2 versicolor ## 94 5.0 2.3 3.3 1.0 versicolor ## 95 5.6 2.7 4.2 1.3 versicolor ## 96 5.7 3.0 4.2 1.2 versicolor ## 97 5.7 2.9 4.2 1.3 versicolor ## 98 6.2 2.9 4.3 1.3 versicolor ## 99 5.1 2.5 3.0 1.1 versicolor ## 100 5.7 2.8 4.1 1.3 versicolor ## 101 6.3 3.3 6.0 2.5 virginica ## 102 5.8 2.7 5.1 1.9 virginica ## 103 7.1 3.0 5.9 2.1 virginica ## 104 6.3 2.9 5.6 1.8 virginica ## 105 6.5 3.0 5.8 2.2 virginica ## 106 7.6 3.0 6.6 2.1 virginica ## 107 4.9 2.5 4.5 1.7 virginica ## 108 7.3 2.9 6.3 1.8 virginica ## 109 6.7 2.5 5.8 1.8 virginica ## 110 7.2 3.6 6.1 2.5 virginica ## 111 6.5 3.2 5.1 2.0 virginica ## 112 6.4 2.7 5.3 1.9 virginica ## 113 6.8 3.0 5.5 2.1 virginica ## 114 5.7 2.5 5.0 2.0 virginica ## 115 5.8 2.8 5.1 2.4 virginica ## 116 6.4 3.2 5.3 2.3 virginica ## 117 6.5 3.0 5.5 1.8 virginica ## 118 7.7 3.8 6.7 2.2 virginica ## 119 7.7 2.6 6.9 2.3 virginica ## 120 6.0 2.2 5.0 1.5 virginica ## 121 6.9 3.2 5.7 2.3 virginica ## 122 5.6 2.8 4.9 2.0 virginica ## 123 7.7 2.8 6.7 2.0 virginica ## 124 6.3 2.7 4.9 1.8 virginica ## 125 6.7 3.3 5.7 2.1 virginica ## 126 7.2 3.2 6.0 1.8 virginica ## 127 6.2 2.8 4.8 1.8 virginica ## 128 6.1 3.0 4.9 1.8 virginica ## 129 6.4 2.8 5.6 2.1 virginica ## 130 7.2 3.0 5.8 1.6 virginica ## 131 7.4 2.8 6.1 1.9 virginica ## 132 7.9 3.8 6.4 2.0 virginica ## 133 6.4 2.8 5.6 2.2 virginica ## 134 6.3 2.8 5.1 1.5 virginica ## 135 6.1 2.6 5.6 1.4 virginica ## 136 7.7 3.0 6.1 2.3 virginica ## 137 6.3 3.4 5.6 2.4 virginica ## 138 6.4 3.1 5.5 1.8 virginica ## 139 6.0 3.0 4.8 1.8 virginica ## 140 6.9 3.1 5.4 2.1 virginica ## 141 6.7 3.1 5.6 2.4 virginica ## 142 6.9 3.1 5.1 2.3 virginica ## 143 5.8 2.7 5.1 1.9 virginica ## 144 6.8 3.2 5.9 2.3 virginica ## 145 6.7 3.3 5.7 2.5 virginica ## 146 6.7 3.0 5.2 2.3 virginica ## 147 6.3 2.5 5.0 1.9 virginica ## 148 6.5 3.0 5.2 2.0 virginica ## 149 6.2 3.4 5.4 2.3 virginica ## 150 5.9 3.0 5.1 1.8 virginica ``` --- # Tibbles print nicely! ```r library(tidyverse) as_tibble(iris) ``` ``` ## # A tibble: 150 x 5 ## Sepal.Length Sepal.Width Petal.Length Petal.Width Species ## <dbl> <dbl> <dbl> <dbl> <fct> ## 1 5.1 3.5 1.4 0.2 setosa ## 2 4.9 3 1.4 0.2 setosa ## 3 4.7 3.2 1.3 0.2 setosa ## 4 4.6 3.1 1.5 0.2 setosa ## 5 5 3.6 1.4 0.2 setosa ## 6 5.4 3.9 1.7 0.4 setosa ## 7 4.6 3.4 1.4 0.3 setosa ## 8 5 3.4 1.5 0.2 setosa ## 9 4.4 2.9 1.4 0.2 setosa ## 10 4.9 3.1 1.5 0.1 setosa ## # … with 140 more rows ``` --- # Pipe ("then") .pull-left[  ] .pull-right[ Data in, data out ```r do_another_thing(do_something(data)) # versus data %>% do_something() %>% do_another_thing() ``` ] .footnote[ * keyboard shortcut: ctrl/cmd + shift + m ] --- --- class: inverse, center, middle # Let's go over the various packages --- class: center, middle # `readr` package <img src="img/readr.png" width=30%> --- # read_xxx function * Neater import than `read.table` and `read.csv` * Does data check and prints a report of the data imported * Character columns are not converted to factors * Most useful are `read_csv`, `read_table`, and `read_delim` * Competible with pipe workflow --- # Example ```r mydata<- read_csv("data/sub_PanTHERIA.csv") ``` ``` ## Parsed with column specification: ## cols( ## Order = col_character(), ## Family = col_character(), ## Genus = col_character(), ## Species = col_character(), ## Binomial = col_character(), ## ActivityCycle = col_character(), ## AdultBodyMass = col_double(), ## GestationLen = col_double(), ## HomeRange = col_double(), ## DietBreadth = col_double(), ## LitterSize = col_double(), ## LittersPerYear = col_double(), ## MaxLongevity = col_double(), ## HabitatBreadth = col_double(), ## NeonateBodyMass = col_double(), ## PopulationDensity = col_double(), ## Terrestriality = col_character(), ## TrophicLevel = col_character() ## ) ``` --- ```r mydata ``` ``` ## # A tibble: 3,268 x 18 ## Order Family Genus Species Binomial ActivityCycle AdultBodyMass GestationLen ## <chr> <chr> <chr> <chr> <chr> <chr> <dbl> <dbl> ## 1 Chir… Crase… Cras… thongl… Craseon… nocturnal 1.96 NA ## 2 Chir… Vespe… Keri… minuta Kerivou… <NA> 2.03 NA ## 3 Sori… Soric… Sunc… etrusc… Suncus … <NA> 2.26 27.5 ## 4 Sori… Soric… Sorex minuti… Sorex m… <NA> 2.46 NA ## 5 Sori… Soric… Sunc… madaga… Suncus … <NA> 2.47 NA ## 6 Sori… Soric… Croc… lusita… Crocidu… <NA> 2.48 NA ## 7 Sori… Soric… Croc… planic… Crocidu… <NA> 2.5 NA ## 8 Chir… Vespe… Pipi… nanulus Pipistr… <NA> 2.51 NA ## 9 Sori… Soric… Sorex nanus Sorex n… <NA> 2.57 NA ## 10 Sori… Soric… Sorex arizon… Sorex a… <NA> 2.7 NA ## # … with 3,258 more rows, and 10 more variables: HomeRange <dbl>, ## # DietBreadth <dbl>, LitterSize <dbl>, LittersPerYear <dbl>, ## # MaxLongevity <dbl>, HabitatBreadth <dbl>, NeonateBodyMass <dbl>, ## # PopulationDensity <dbl>, Terrestriality <chr>, TrophicLevel <chr> ``` --- class: center, middle # `janitor` package <img src="img/janitor.png" width=40%> --- # `clean_names()` function * cleans the column names to something more computer friendly * For example, brings all the column names to lowercase and adds underscores between words --- # Regular column names ```r mydata ``` ``` ## # A tibble: 3,268 x 18 ## Order Family Genus Species Binomial ActivityCycle AdultBodyMass GestationLen ## <chr> <chr> <chr> <chr> <chr> <chr> <dbl> <dbl> ## 1 Chir… Crase… Cras… thongl… Craseon… nocturnal 1.96 NA ## 2 Chir… Vespe… Keri… minuta Kerivou… <NA> 2.03 NA ## 3 Sori… Soric… Sunc… etrusc… Suncus … <NA> 2.26 27.5 ## 4 Sori… Soric… Sorex minuti… Sorex m… <NA> 2.46 NA ## 5 Sori… Soric… Sunc… madaga… Suncus … <NA> 2.47 NA ## 6 Sori… Soric… Croc… lusita… Crocidu… <NA> 2.48 NA ## 7 Sori… Soric… Croc… planic… Crocidu… <NA> 2.5 NA ## 8 Chir… Vespe… Pipi… nanulus Pipistr… <NA> 2.51 NA ## 9 Sori… Soric… Sorex nanus Sorex n… <NA> 2.57 NA ## 10 Sori… Soric… Sorex arizon… Sorex a… <NA> 2.7 NA ## # … with 3,258 more rows, and 10 more variables: HomeRange <dbl>, ## # DietBreadth <dbl>, LitterSize <dbl>, LittersPerYear <dbl>, ## # MaxLongevity <dbl>, HabitatBreadth <dbl>, NeonateBodyMass <dbl>, ## # PopulationDensity <dbl>, Terrestriality <chr>, TrophicLevel <chr> ``` --- # Clean column names ```r mydata %>% * janitor::clean_names() ``` ``` ## # A tibble: 3,268 x 18 ## order family genus species binomial activity_cycle adult_body_mass ## <chr> <chr> <chr> <chr> <chr> <chr> <dbl> ## 1 Chir… Crase… Cras… thongl… Craseon… nocturnal 1.96 ## 2 Chir… Vespe… Keri… minuta Kerivou… <NA> 2.03 ## 3 Sori… Soric… Sunc… etrusc… Suncus … <NA> 2.26 ## 4 Sori… Soric… Sorex minuti… Sorex m… <NA> 2.46 ## 5 Sori… Soric… Sunc… madaga… Suncus … <NA> 2.47 ## 6 Sori… Soric… Croc… lusita… Crocidu… <NA> 2.48 ## 7 Sori… Soric… Croc… planic… Crocidu… <NA> 2.5 ## 8 Chir… Vespe… Pipi… nanulus Pipistr… <NA> 2.51 ## 9 Sori… Soric… Sorex nanus Sorex n… <NA> 2.57 ## 10 Sori… Soric… Sorex arizon… Sorex a… <NA> 2.7 ## # … with 3,258 more rows, and 11 more variables: gestation_len <dbl>, ## # home_range <dbl>, diet_breadth <dbl>, litter_size <dbl>, ## # litters_per_year <dbl>, max_longevity <dbl>, habitat_breadth <dbl>, ## # neonate_body_mass <dbl>, population_density <dbl>, terrestriality <chr>, ## # trophic_level <chr> ``` --- # Can also be: ```r mydata<- read_csv("data/sub_PanTHERIA.csv") %>% janitor::clean_names() mydata ``` ``` ## # A tibble: 3,268 x 18 ## order family genus species binomial activity_cycle adult_body_mass ## <chr> <chr> <chr> <chr> <chr> <chr> <dbl> ## 1 Chir… Crase… Cras… thongl… Craseon… nocturnal 1.96 ## 2 Chir… Vespe… Keri… minuta Kerivou… <NA> 2.03 ## 3 Sori… Soric… Sunc… etrusc… Suncus … <NA> 2.26 ## 4 Sori… Soric… Sorex minuti… Sorex m… <NA> 2.46 ## 5 Sori… Soric… Sunc… madaga… Suncus … <NA> 2.47 ## 6 Sori… Soric… Croc… lusita… Crocidu… <NA> 2.48 ## 7 Sori… Soric… Croc… planic… Crocidu… <NA> 2.5 ## 8 Chir… Vespe… Pipi… nanulus Pipistr… <NA> 2.51 ## 9 Sori… Soric… Sorex nanus Sorex n… <NA> 2.57 ## 10 Sori… Soric… Sorex arizon… Sorex a… <NA> 2.7 ## # … with 3,258 more rows, and 11 more variables: gestation_len <dbl>, ## # home_range <dbl>, diet_breadth <dbl>, litter_size <dbl>, ## # litters_per_year <dbl>, max_longevity <dbl>, habitat_breadth <dbl>, ## # neonate_body_mass <dbl>, population_density <dbl>, terrestriality <chr>, ## # trophic_level <chr> ``` --- class: exercise, center, middle # Lets practice! ## Load the data and change all the column names to caps lock .footnote[ **Hint:** Check the help file for the `clean_names()` function ] --- class: center, middle # `dplyr` function <img src="img/dplyr.png" width=30%> --- # Load the Star Wars data ```r library(tidyverse) data(starwars) starwars ``` ``` ## # A tibble: 87 x 14 ## name height mass hair_color skin_color eye_color birth_year sex gender ## <chr> <int> <dbl> <chr> <chr> <chr> <dbl> <chr> <chr> ## 1 Luke… 172 77 blond fair blue 19 male mascu… ## 2 C-3PO 167 75 <NA> gold yellow 112 none mascu… ## 3 R2-D2 96 32 <NA> white, bl… red 33 none mascu… ## 4 Dart… 202 136 none white yellow 41.9 male mascu… ## 5 Leia… 150 49 brown light brown 19 fema… femin… ## 6 Owen… 178 120 brown, gr… light blue 52 male mascu… ## 7 Beru… 165 75 brown light blue 47 fema… femin… ## 8 R5-D4 97 32 <NA> white, red red NA none mascu… ## 9 Bigg… 183 84 black light brown 24 male mascu… ## 10 Obi-… 182 77 auburn, w… fair blue-gray 57 male mascu… ## # … with 77 more rows, and 5 more variables: homeworld <chr>, species <chr>, ## # films <list>, vehicles <list>, starships <list> ``` --- # `select()`  --- # Select the name, height, mass, and species columns only ```r starwars %>% * select(name, height, mass, species) ``` ``` ## # A tibble: 87 x 4 ## name height mass species ## <chr> <int> <dbl> <chr> ## 1 Luke Skywalker 172 77 Human ## 2 C-3PO 167 75 Droid ## 3 R2-D2 96 32 Droid ## 4 Darth Vader 202 136 Human ## 5 Leia Organa 150 49 Human ## 6 Owen Lars 178 120 Human ## 7 Beru Whitesun lars 165 75 Human ## 8 R5-D4 97 32 Droid ## 9 Biggs Darklighter 183 84 Human ## 10 Obi-Wan Kenobi 182 77 Human ## # … with 77 more rows ``` --- # `mutate()`  --- # Add a bmi column ```r starwars %>% select(name, height, mass, species) %>% * mutate(bmi = mass/(0.01*height)^2) ``` ``` ## # A tibble: 87 x 5 ## name height mass species bmi ## <chr> <int> <dbl> <chr> <dbl> ## 1 Luke Skywalker 172 77 Human 26.0 ## 2 C-3PO 167 75 Droid 26.9 ## 3 R2-D2 96 32 Droid 34.7 ## 4 Darth Vader 202 136 Human 33.3 ## 5 Leia Organa 150 49 Human 21.8 ## 6 Owen Lars 178 120 Human 37.9 ## 7 Beru Whitesun lars 165 75 Human 27.5 ## 8 R5-D4 97 32 Droid 34.0 ## 9 Biggs Darklighter 183 84 Human 25.1 ## 10 Obi-Wan Kenobi 182 77 Human 23.2 ## # … with 77 more rows ``` --- class: exercise, center, middle # Your turn! ## select the height, gender, and species and add a new column with height in meters --- # `filter()`  --- # Filter the data to have only Droids (found in species column) ```r starwars %>% select(name, height, mass, species) %>% mutate(bmi = mass/(0.01*height)^2) %>% * filter(species == "Droid") ``` ``` ## # A tibble: 6 x 5 ## name height mass species bmi ## <chr> <int> <dbl> <chr> <dbl> ## 1 C-3PO 167 75 Droid 26.9 ## 2 R2-D2 96 32 Droid 34.7 ## 3 R5-D4 97 32 Droid 34.0 ## 4 IG-88 200 140 Droid 35 ## 5 R4-P17 96 NA Droid NA ## 6 BB8 NA NA Droid NA ``` --- # Filter the same data to have only Droids shorter than 100 cm ```r starwars %>% select(name, height, mass, species) %>% mutate(bmi = mass/(0.01*height)^2) %>% * filter(species == "Droid", height < 100) ``` ``` ## # A tibble: 3 x 5 ## name height mass species bmi ## <chr> <int> <dbl> <chr> <dbl> ## 1 R2-D2 96 32 Droid 34.7 ## 2 R5-D4 97 32 Droid 34.0 ## 3 R4-P17 96 NA Droid NA ``` --- # `arrange()`  --- # Sort the data based on the bmi ```r starwars %>% select(name, height, mass, species) %>% mutate(bmi = mass/(0.01*height)^2) %>% * arrange(desc(bmi)) ``` ``` ## # A tibble: 87 x 5 ## name height mass species bmi ## <chr> <int> <dbl> <chr> <dbl> ## 1 Jabba Desilijic Tiure 175 1358 Hutt 443. ## 2 Dud Bolt 94 45 Vulptereen 50.9 ## 3 Yoda 66 17 Yoda's species 39.0 ## 4 Owen Lars 178 120 Human 37.9 ## 5 IG-88 200 140 Droid 35 ## 6 R2-D2 96 32 Droid 34.7 ## 7 Grievous 216 159 Kaleesh 34.1 ## 8 R5-D4 97 32 Droid 34.0 ## 9 Jek Tono Porkins 180 110 Human 34.0 ## 10 Darth Vader 202 136 Human 33.3 ## # … with 77 more rows ``` --- # `group_by(), summarize()` 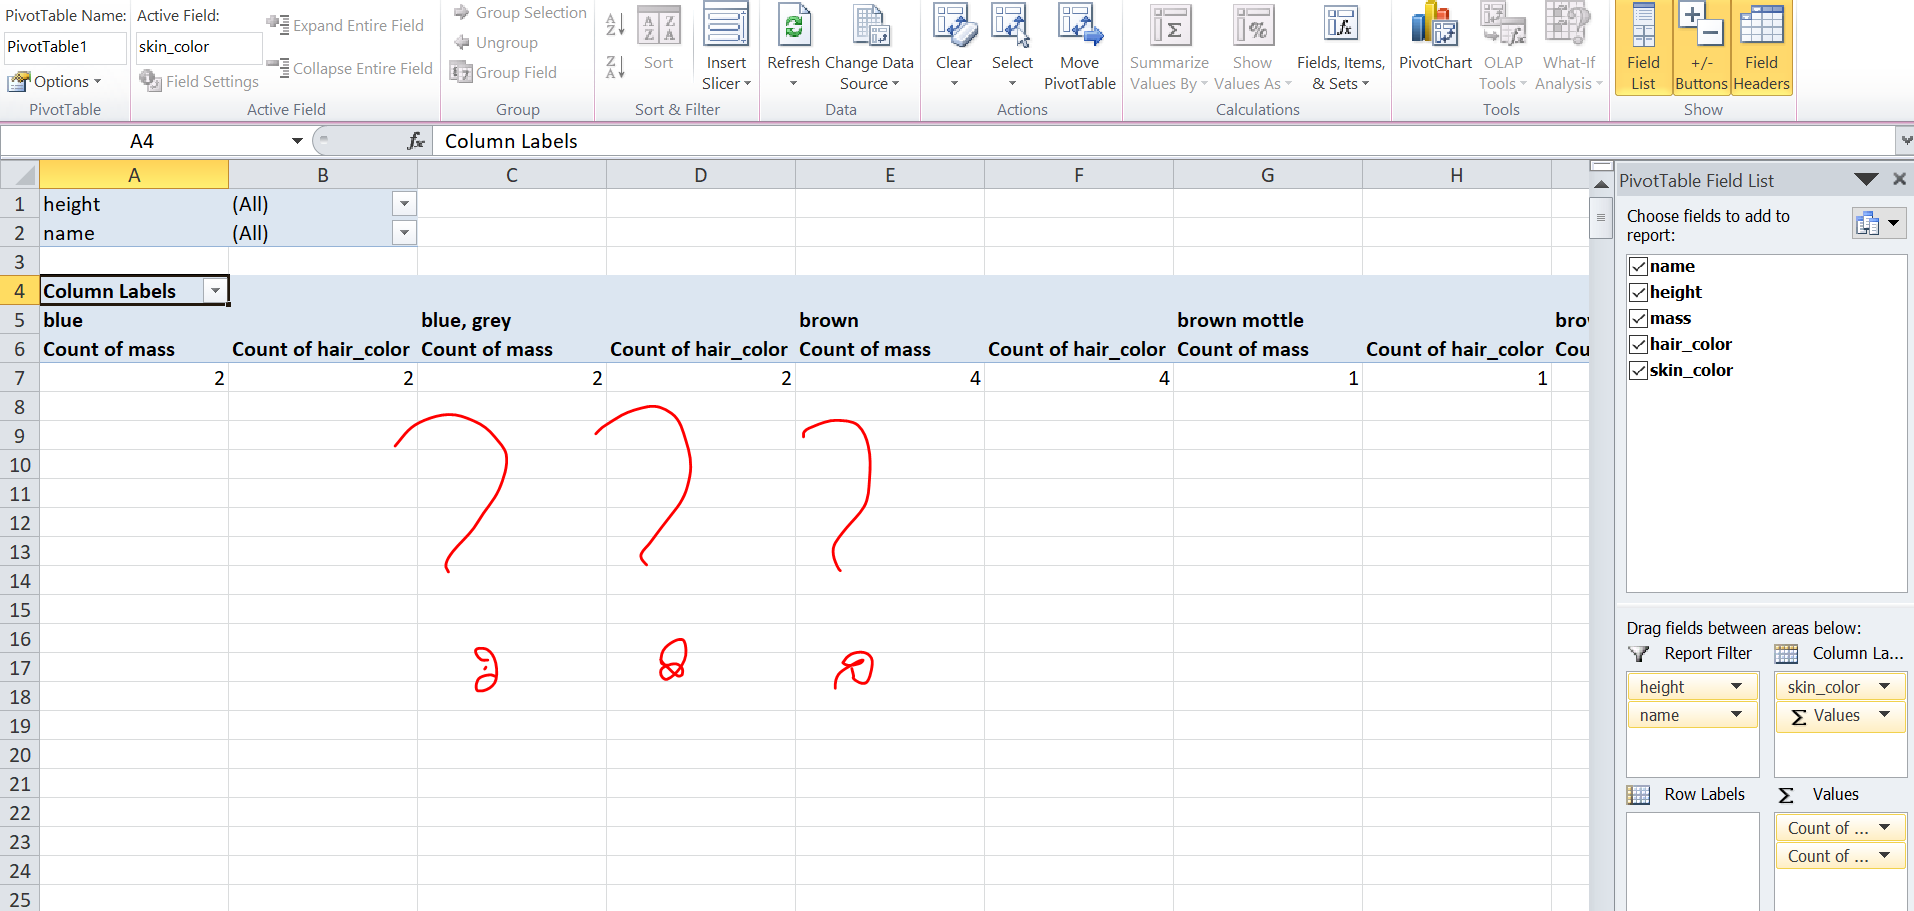 --- ## Create a summary data in which you have the avarage mass and maximum hight for each species, ## and sort it by the avarage mass ```r starwars %>% select(name, height, mass, species) %>% * group_by(species) %>% * summarize(avg_mass = mean(mass, na.rm = TRUE), max_height = max(height, na.rm = TRUE)) %>% * arrange(desc(avg_mass)) ``` ``` ## # A tibble: 38 x 3 ## species avg_mass max_height ## <chr> <dbl> <int> ## 1 Hutt 1358 175 ## 2 Kaleesh 159 216 ## 3 Wookiee 124 234 ## 4 Trandoshan 113 190 ## 5 Besalisk 102 198 ## 6 Neimodian 90 191 ## 7 Kaminoan 88 229 ## 8 Nautolan 87 196 ## 9 Mon Calamari 83 180 ## 10 Human 82.8 202 ## # … with 28 more rows ``` --- class: exercise, middle # Your turn! What is the most common eye color? Who is the youngest human? Which homeworld has the most characters? --- # Rename columns with `rename()` ```r starwars %>% select(name, height, mass, species) %>% * rename(char_name = name) ``` ``` ## # A tibble: 87 x 4 ## char_name height mass species ## <chr> <int> <dbl> <chr> ## 1 Luke Skywalker 172 77 Human ## 2 C-3PO 167 75 Droid ## 3 R2-D2 96 32 Droid ## 4 Darth Vader 202 136 Human ## 5 Leia Organa 150 49 Human ## 6 Owen Lars 178 120 Human ## 7 Beru Whitesun lars 165 75 Human ## 8 R5-D4 97 32 Droid ## 9 Biggs Darklighter 183 84 Human ## 10 Obi-Wan Kenobi 182 77 Human ## # … with 77 more rows ``` --- # `rename_all()` Change all the column names to upper case ```r starwars %>% select(name, height, mass, species) %>% * rename_all(toupper) ``` ``` ## # A tibble: 87 x 4 ## NAME HEIGHT MASS SPECIES ## <chr> <int> <dbl> <chr> ## 1 Luke Skywalker 172 77 Human ## 2 C-3PO 167 75 Droid ## 3 R2-D2 96 32 Droid ## 4 Darth Vader 202 136 Human ## 5 Leia Organa 150 49 Human ## 6 Owen Lars 178 120 Human ## 7 Beru Whitesun lars 165 75 Human ## 8 R5-D4 97 32 Droid ## 9 Biggs Darklighter 183 84 Human ## 10 Obi-Wan Kenobi 182 77 Human ## # … with 77 more rows ``` --- # `left_join()` ```r starwars %>% mutate(height_m = height*0.01) %>% select(name,height_m) %>% * left_join(starwars,by = "name") ``` ``` ## # A tibble: 87 x 15 ## name height_m height mass hair_color skin_color eye_color birth_year sex ## <chr> <dbl> <int> <dbl> <chr> <chr> <chr> <dbl> <chr> ## 1 Luke… 1.72 172 77 blond fair blue 19 male ## 2 C-3PO 1.67 167 75 <NA> gold yellow 112 none ## 3 R2-D2 0.96 96 32 <NA> white, bl… red 33 none ## 4 Dart… 2.02 202 136 none white yellow 41.9 male ## 5 Leia… 1.5 150 49 brown light brown 19 fema… ## 6 Owen… 1.78 178 120 brown, gr… light blue 52 male ## 7 Beru… 1.65 165 75 brown light blue 47 fema… ## 8 R5-D4 0.97 97 32 <NA> white, red red NA none ## 9 Bigg… 1.83 183 84 black light brown 24 male ## 10 Obi-… 1.82 182 77 auburn, w… fair blue-gray 57 male ## # … with 77 more rows, and 6 more variables: gender <chr>, homeworld <chr>, ## # species <chr>, films <list>, vehicles <list>, starships <list> ``` --- class: exercise, center, middle # Practice time! Create a new data with species, mass, and height, calculate the bmi, and join it with the starwars data --- # What else can you do? - conditional functions: `*_at`, `*_if`, `*_all` - `lead` & `lag` for time series - `inner_join`,`semi_join` - `bind_cols`, `bind_rows` --- class: center, middle # `tidyr` functions <img src="img/tidyr.png" width=30%> --- ### spread == pivot_wider ### gather == pivot_longer 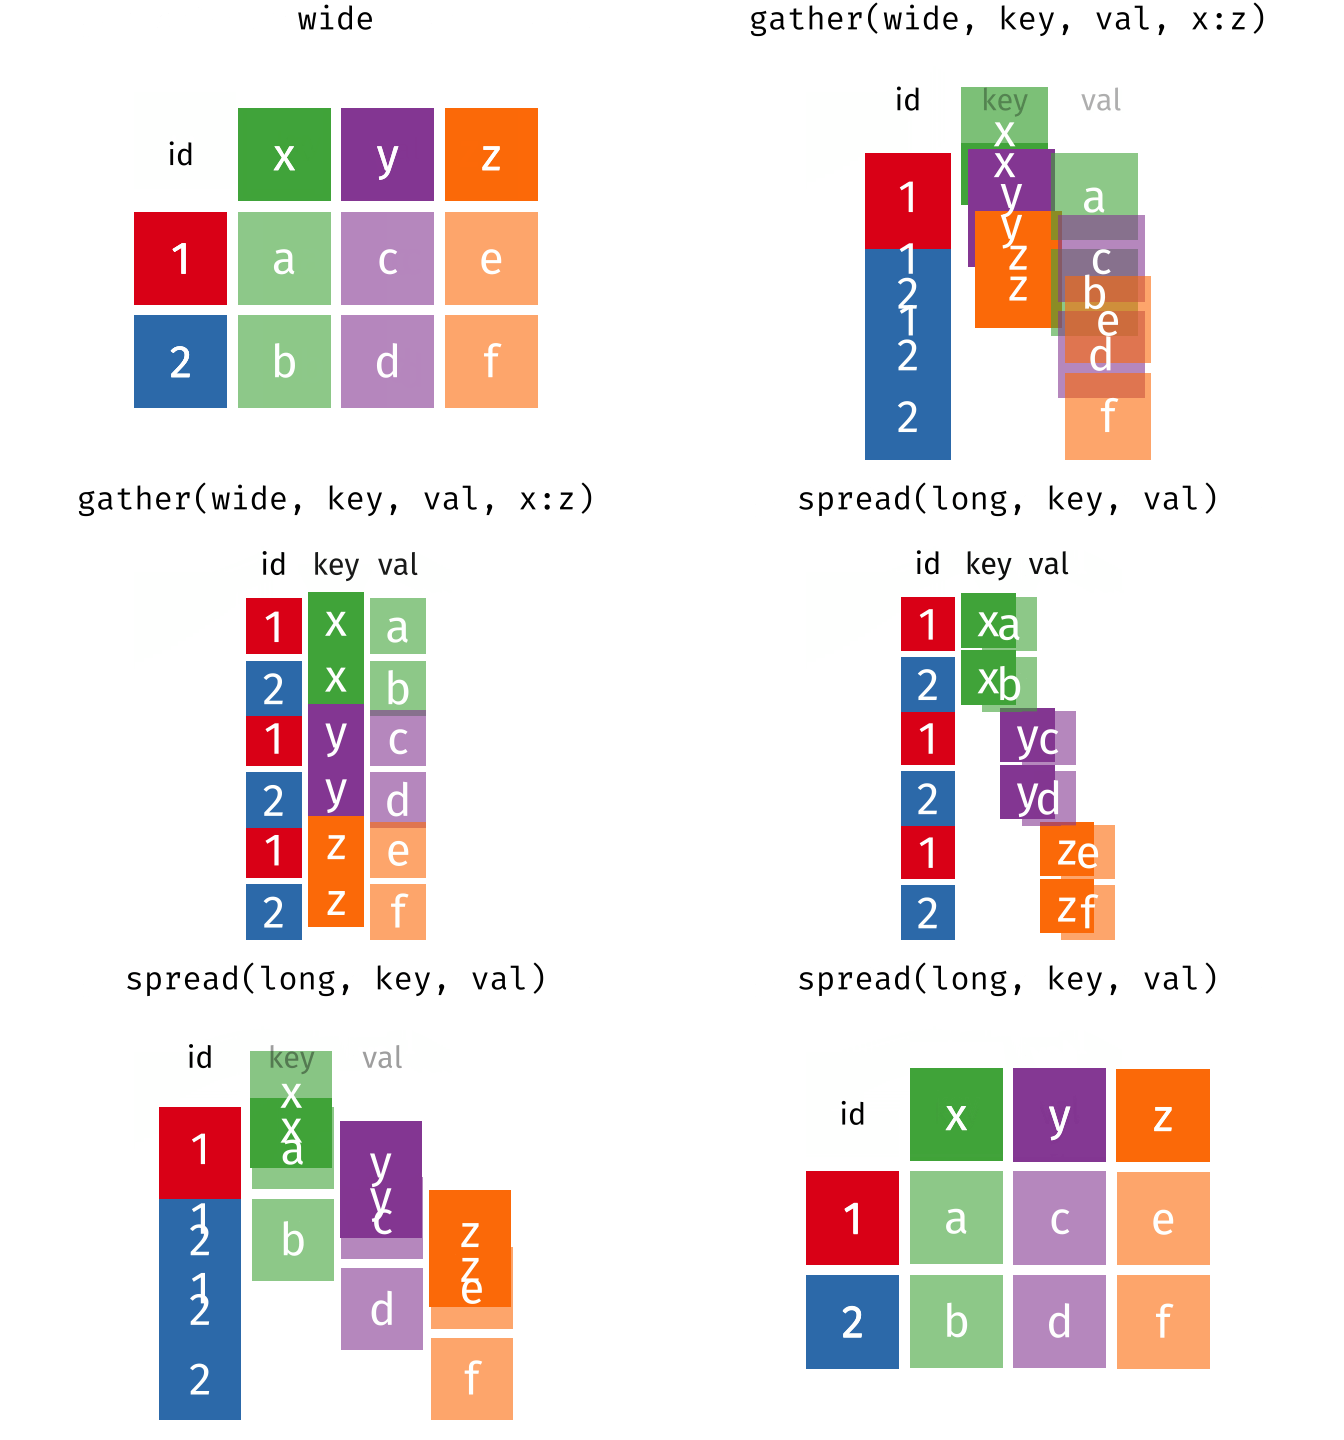 --- # Community matrix! ```r sw <- starwars %>% select(name, films) %>% unnest(films) %>% mutate(present = 1) %>% * pivot_wider(names_from = name,values_from = present,values_fill = list(present = 0)) %>% janitor::clean_names() %>% print() ``` ``` ## # A tibble: 7 x 88 ## films luke_skywalker c_3po r2_d2 darth_vader leia_organa owen_lars ## <chr> <dbl> <dbl> <dbl> <dbl> <dbl> <dbl> ## 1 The … 1 1 1 1 1 0 ## 2 Reve… 1 1 1 1 1 1 ## 3 Retu… 1 1 1 1 1 0 ## 4 A Ne… 1 1 1 1 1 1 ## 5 The … 1 0 1 0 1 0 ## 6 Atta… 0 1 1 0 0 1 ## 7 The … 0 1 1 0 0 0 ## # … with 81 more variables: beru_whitesun_lars <dbl>, r5_d4 <dbl>, ## # biggs_darklighter <dbl>, obi_wan_kenobi <dbl>, anakin_skywalker <dbl>, ## # wilhuff_tarkin <dbl>, chewbacca <dbl>, han_solo <dbl>, greedo <dbl>, ## # jabba_desilijic_tiure <dbl>, wedge_antilles <dbl>, jek_tono_porkins <dbl>, ## # yoda <dbl>, palpatine <dbl>, boba_fett <dbl>, ig_88 <dbl>, bossk <dbl>, ## # lando_calrissian <dbl>, lobot <dbl>, ackbar <dbl>, mon_mothma <dbl>, ## # arvel_crynyd <dbl>, wicket_systri_warrick <dbl>, nien_nunb <dbl>, ## # qui_gon_jinn <dbl>, nute_gunray <dbl>, finis_valorum <dbl>, ## # jar_jar_binks <dbl>, roos_tarpals <dbl>, rugor_nass <dbl>, ric_olie <dbl>, ## # watto <dbl>, sebulba <dbl>, quarsh_panaka <dbl>, shmi_skywalker <dbl>, ## # darth_maul <dbl>, bib_fortuna <dbl>, ayla_secura <dbl>, dud_bolt <dbl>, ## # gasgano <dbl>, ben_quadinaros <dbl>, mace_windu <dbl>, ki_adi_mundi <dbl>, ## # kit_fisto <dbl>, eeth_koth <dbl>, adi_gallia <dbl>, saesee_tiin <dbl>, ## # yarael_poof <dbl>, plo_koon <dbl>, mas_amedda <dbl>, gregar_typho <dbl>, ## # corde <dbl>, cliegg_lars <dbl>, poggle_the_lesser <dbl>, ## # luminara_unduli <dbl>, barriss_offee <dbl>, dorme <dbl>, dooku <dbl>, ## # bail_prestor_organa <dbl>, jango_fett <dbl>, zam_wesell <dbl>, ## # dexter_jettster <dbl>, lama_su <dbl>, taun_we <dbl>, jocasta_nu <dbl>, ## # ratts_tyerell <dbl>, r4_p17 <dbl>, wat_tambor <dbl>, san_hill <dbl>, ## # shaak_ti <dbl>, grievous <dbl>, tarfful <dbl>, raymus_antilles <dbl>, ## # sly_moore <dbl>, tion_medon <dbl>, finn <dbl>, rey <dbl>, ## # poe_dameron <dbl>, bb8 <dbl>, captain_phasma <dbl>, padme_amidala <dbl> ``` --- # Gather back the community matrix to a long format ```r sw %>% * pivot_longer(cols = -films,names_to = "name",values_to = "present") ``` ``` ## # A tibble: 609 x 3 ## films name present ## <chr> <chr> <dbl> ## 1 The Empire Strikes Back luke_skywalker 1 ## 2 The Empire Strikes Back c_3po 1 ## 3 The Empire Strikes Back r2_d2 1 ## 4 The Empire Strikes Back darth_vader 1 ## 5 The Empire Strikes Back leia_organa 1 ## 6 The Empire Strikes Back owen_lars 0 ## 7 The Empire Strikes Back beru_whitesun_lars 0 ## 8 The Empire Strikes Back r5_d4 0 ## 9 The Empire Strikes Back biggs_darklighter 0 ## 10 The Empire Strikes Back obi_wan_kenobi 1 ## # … with 599 more rows ``` --- class: exercise, center, middle #Lets practice! Subset the data to have species, mass, height, and birth year columns. Then create a long format with species as untouched column, one column with the categories (mass,height, birth year), and one column with the values. --- .center[ # Other function that are compatible with ` %>% ` ] --- ## `ggplot2` * can be piped into the sequence ```r starwars %>% select(height,mass,species) %>% * ggplot(.,aes(log10(mass),log10(height),color = species))+ geom_point()+ theme(legend.position = "none") ``` <!-- --> --- ### omit all rows that contain `NA` somewhere in the data ```r starwars %>% * na.omit() ``` ``` ## # A tibble: 29 x 14 ## name height mass hair_color skin_color eye_color birth_year sex gender ## <chr> <int> <dbl> <chr> <chr> <chr> <dbl> <chr> <chr> ## 1 Luke… 172 77 blond fair blue 19 male mascu… ## 2 Dart… 202 136 none white yellow 41.9 male mascu… ## 3 Leia… 150 49 brown light brown 19 fema… femin… ## 4 Owen… 178 120 brown, gr… light blue 52 male mascu… ## 5 Beru… 165 75 brown light blue 47 fema… femin… ## 6 Bigg… 183 84 black light brown 24 male mascu… ## 7 Obi-… 182 77 auburn, w… fair blue-gray 57 male mascu… ## 8 Anak… 188 84 blond fair blue 41.9 male mascu… ## 9 Chew… 228 112 brown unknown blue 200 male mascu… ## 10 Han … 180 80 brown fair brown 29 male mascu… ## # … with 19 more rows, and 5 more variables: homeworld <chr>, species <chr>, ## # films <list>, vehicles <list>, starships <list> ``` --- # Run models on subset of the data ```r starwars %>% filter(species =="Droid") %>% * lm(height~mass,data = .) %>% summary() ``` ``` ## ## Call: ## lm(formula = height ~ mass, data = .) ## ## Residuals: ## 1 2 3 4 ## 21.865 -7.080 -6.080 -8.706 ## ## Coefficients: ## Estimate Std. Error t value Pr(>|t|) ## (Intercept) 71.7833 16.7240 4.292 0.0502 . ## mass 0.9780 0.2025 4.829 0.0403 * ## --- ## Signif. codes: 0 '***' 0.001 '**' 0.01 '*' 0.05 '.' 0.1 ' ' 1 ## ## Residual standard error: 17.9 on 2 degrees of freedom ## (2 observations deleted due to missingness) ## Multiple R-squared: 0.921, Adjusted R-squared: 0.8815 ## F-statistic: 23.32 on 1 and 2 DF, p-value: 0.04031 ``` --- class: center, middle # `broom` package <img src="img/broom.png" width=30%> --- # `tidy()` function Allows you to print and save model results in a tabular view --- # Make it into a nice tibble ```r starwars %>% filter(species =="Droid") %>% lm(height~mass,data = .) %>% summary()%>% * broom::tidy() ``` ``` ## # A tibble: 2 x 5 ## term estimate std.error statistic p.value ## <chr> <dbl> <dbl> <dbl> <dbl> ## 1 (Intercept) 71.8 16.7 4.29 0.0502 ## 2 mass 0.978 0.203 4.83 0.0403 ``` --- class: inverse, center, middle # Homework Time --- # Some instructions - Uninstall the previous lesson with `uninstall_course("exercise_REcoStat2020")` - Re-install it with `install_course_github("marianovosolov","exercise_REcoStat2020")` - Start with `swirl()` - Give it a new name - Choose the tidyverse exercise within the exercise_REcoStat2020 - Good luck!! --- class: inverse, center, middle # Additional useful (though more tricky to understand) functions --- # `nest` datasets Useful when you want to run analyses group based but run it only ones ```r nested_sw<- starwars %>% select(name,height,films,mass, species,gender) %>% group_by(gender) %>% * nest() %>% print() ``` ``` ## # A tibble: 3 x 2 ## # Groups: gender [3] ## gender data ## <chr> <list> ## 1 masculine <tibble [66 × 5]> ## 2 feminine <tibble [17 × 5]> ## 3 <NA> <tibble [4 × 5]> ``` --- # To see the first sub data ```r nested_sw$data[1] ``` ``` ## [[1]] ## # A tibble: 66 x 5 ## name height films mass species ## <chr> <int> <list> <dbl> <chr> ## 1 Luke Skywalker 172 <chr [5]> 77 Human ## 2 C-3PO 167 <chr [6]> 75 Droid ## 3 R2-D2 96 <chr [7]> 32 Droid ## 4 Darth Vader 202 <chr [4]> 136 Human ## 5 Owen Lars 178 <chr [3]> 120 Human ## 6 R5-D4 97 <chr [1]> 32 Droid ## 7 Biggs Darklighter 183 <chr [1]> 84 Human ## 8 Obi-Wan Kenobi 182 <chr [6]> 77 Human ## 9 Anakin Skywalker 188 <chr [3]> 84 Human ## 10 Wilhuff Tarkin 180 <chr [2]> NA Human ## # … with 56 more rows ``` --- class: center, middle # `purrr` package <img src="img/purrr.png" width=30%> --- # `map` function * transform the input by applying a function to each element. (similar to `apply` function) ```r starwars %>% split(.$gender) %>% * map(~ summary(lm(height~mass,data = .))) ``` ``` ## $feminine ## ## Call: ## lm(formula = height ~ mass, data = .) ## ## Residuals: ## Min 1Q Median 3Q Max ## -19.005 -3.773 -1.351 8.533 14.938 ## ## Coefficients: ## Estimate Std. Error t value Pr(>|t|) ## (Intercept) 166.1725 24.1378 6.884 0.000235 *** ## mass 0.0578 0.4366 0.132 0.898409 ## --- ## Signif. codes: 0 '***' 0.001 '**' 0.01 '*' 0.05 '.' 0.1 ' ' 1 ## ## Residual standard error: 10.61 on 7 degrees of freedom ## (8 observations deleted due to missingness) ## Multiple R-squared: 0.002497, Adjusted R-squared: -0.14 ## F-statistic: 0.01752 on 1 and 7 DF, p-value: 0.8984 ## ## ## $masculine ## ## Call: ## lm(formula = height ~ mass, data = .) ## ## Residuals: ## Min 1Q Median 3Q Max ## -106.365 -3.947 8.917 19.790 58.390 ## ## Coefficients: ## Estimate Std. Error t value Pr(>|t|) ## (Intercept) 171.90167 6.41633 26.791 <2e-16 *** ## mass 0.02727 0.03032 0.899 0.373 ## --- ## Signif. codes: 0 '***' 0.001 '**' 0.01 '*' 0.05 '.' 0.1 ' ' 1 ## ## Residual standard error: 38.86 on 47 degrees of freedom ## (17 observations deleted due to missingness) ## Multiple R-squared: 0.01692, Adjusted R-squared: -0.004001 ## F-statistic: 0.8087 on 1 and 47 DF, p-value: 0.3731 ``` --- # Combine `nest()` with `map()` ```r lm_nest<- starwars %>% group_by(gender) %>% nest() %>% * mutate(lm_results = map(data,~ summary(lm(height~mass,data =.)))) %>% print() ``` ``` ## # A tibble: 3 x 3 ## # Groups: gender [3] ## gender data lm_results ## <chr> <list> <list> ## 1 masculine <tibble [66 × 13]> <smmry.lm> ## 2 feminine <tibble [17 × 13]> <smmry.lm> ## 3 <NA> <tibble [4 × 13]> <smmry.lm> ``` --- ```r lm_nest$lm_results[1] ``` ``` ## [[1]] ## ## Call: ## lm(formula = height ~ mass, data = .) ## ## Residuals: ## Min 1Q Median 3Q Max ## -106.365 -3.947 8.917 19.790 58.390 ## ## Coefficients: ## Estimate Std. Error t value Pr(>|t|) ## (Intercept) 171.90167 6.41633 26.791 <2e-16 *** ## mass 0.02727 0.03032 0.899 0.373 ## --- ## Signif. codes: 0 '***' 0.001 '**' 0.01 '*' 0.05 '.' 0.1 ' ' 1 ## ## Residual standard error: 38.86 on 47 degrees of freedom ## (17 observations deleted due to missingness) ## Multiple R-squared: 0.01692, Adjusted R-squared: -0.004001 ## F-statistic: 0.8087 on 1 and 47 DF, p-value: 0.3731 ``` --- class: inverse, center, middle # Now it's really the end <i class="fas fa-smile "></i>